For a specialist collectibles retailer, being found for the right product can matter more than being seen by everyone. Poptopia’s campaign data shows broader keyword visibility, more organic visits, and growth in recorded purchase activity.
Poptopia is a small online collectibles store. Its catalog spans products and collections such as Funko Pop!, FiGPiN, and starter boxes—ranges where a shopper may already know the character, franchise, or product type they want.
At the first reported checkpoint, the tracked set had nine first-page keywords and six in the top three. April’s organic traffic stood at 714 sessions. That gave the campaign a clear starting point for measuring a wider search presence and more activity on the store.
The opportunity: connect a specialist catalog with specific demand.
The supplied keyword examples include starter-box searches, brand-and-product terms, character names, and purchase-led queries. They show the range of discovery opportunities behind the headline growth.
The ecommerce SEO work
Research first. Then improve the store.
Our campaign connected business and competitor research with keyword planning, critical technical fixes, on-page optimization throughout the site, and link building.
01
Understand the business and its competitors
We began with a business and competition study to understand Poptopia’s market, its specialist catalog, and the stores competing for the same searches. This research established the context for the SEO priorities.
02
Research the keywords behind the catalog
Keyword research identified relevant opportunities around product types, brands, and collector searches. The ranking report tracks progress across themes such as starter boxes, FiGPiN products, and character-specific queries.
03
Resolve critical technical issues
We addressed critical technical issues across the website as part of the campaign’s foundation. This work supported the wider optimization effort; the supplied reporting does not assign a separate traffic lift to any single fix.
04
Optimize pages throughout the site
We carried out on-page optimization throughout the website, bringing the keyword research into the work on the store’s pages. The aim was a clearer connection between what the catalog offered and the searches relevant to those products.
05
Build links alongside on-site improvements
Link building formed another part of the campaign, complementing the research, technical work, and on-page optimization. The approach combined improvements on the store with work on its wider web presence.
What the keyword results reveal
Several ways to find the same store.
01 / COLLECTIONS
Starter-box searches
“Funko PoP Starter Box” moved from position 7 to 1, while the Movies starter-box term moved from 5 to 1.
02 / SPECIFIC PRODUCTS
Character-led discovery
“flame swordsman figpin” reached position 1 in the January report. “attack on titan figpin” reached position 5.
03 / SHOPPING INTENT
Collector categories
“FiGPiN collectibles” and “buy figpin collectibles” both appeared at position 3 in the final supplied check.
Keyword examples compare April 10, 2023 with January 15, 2024. These are reported search positions, not a record of which query generated a purchase.
02 / Organic discovery & visits
A larger audience. A visible change over time.
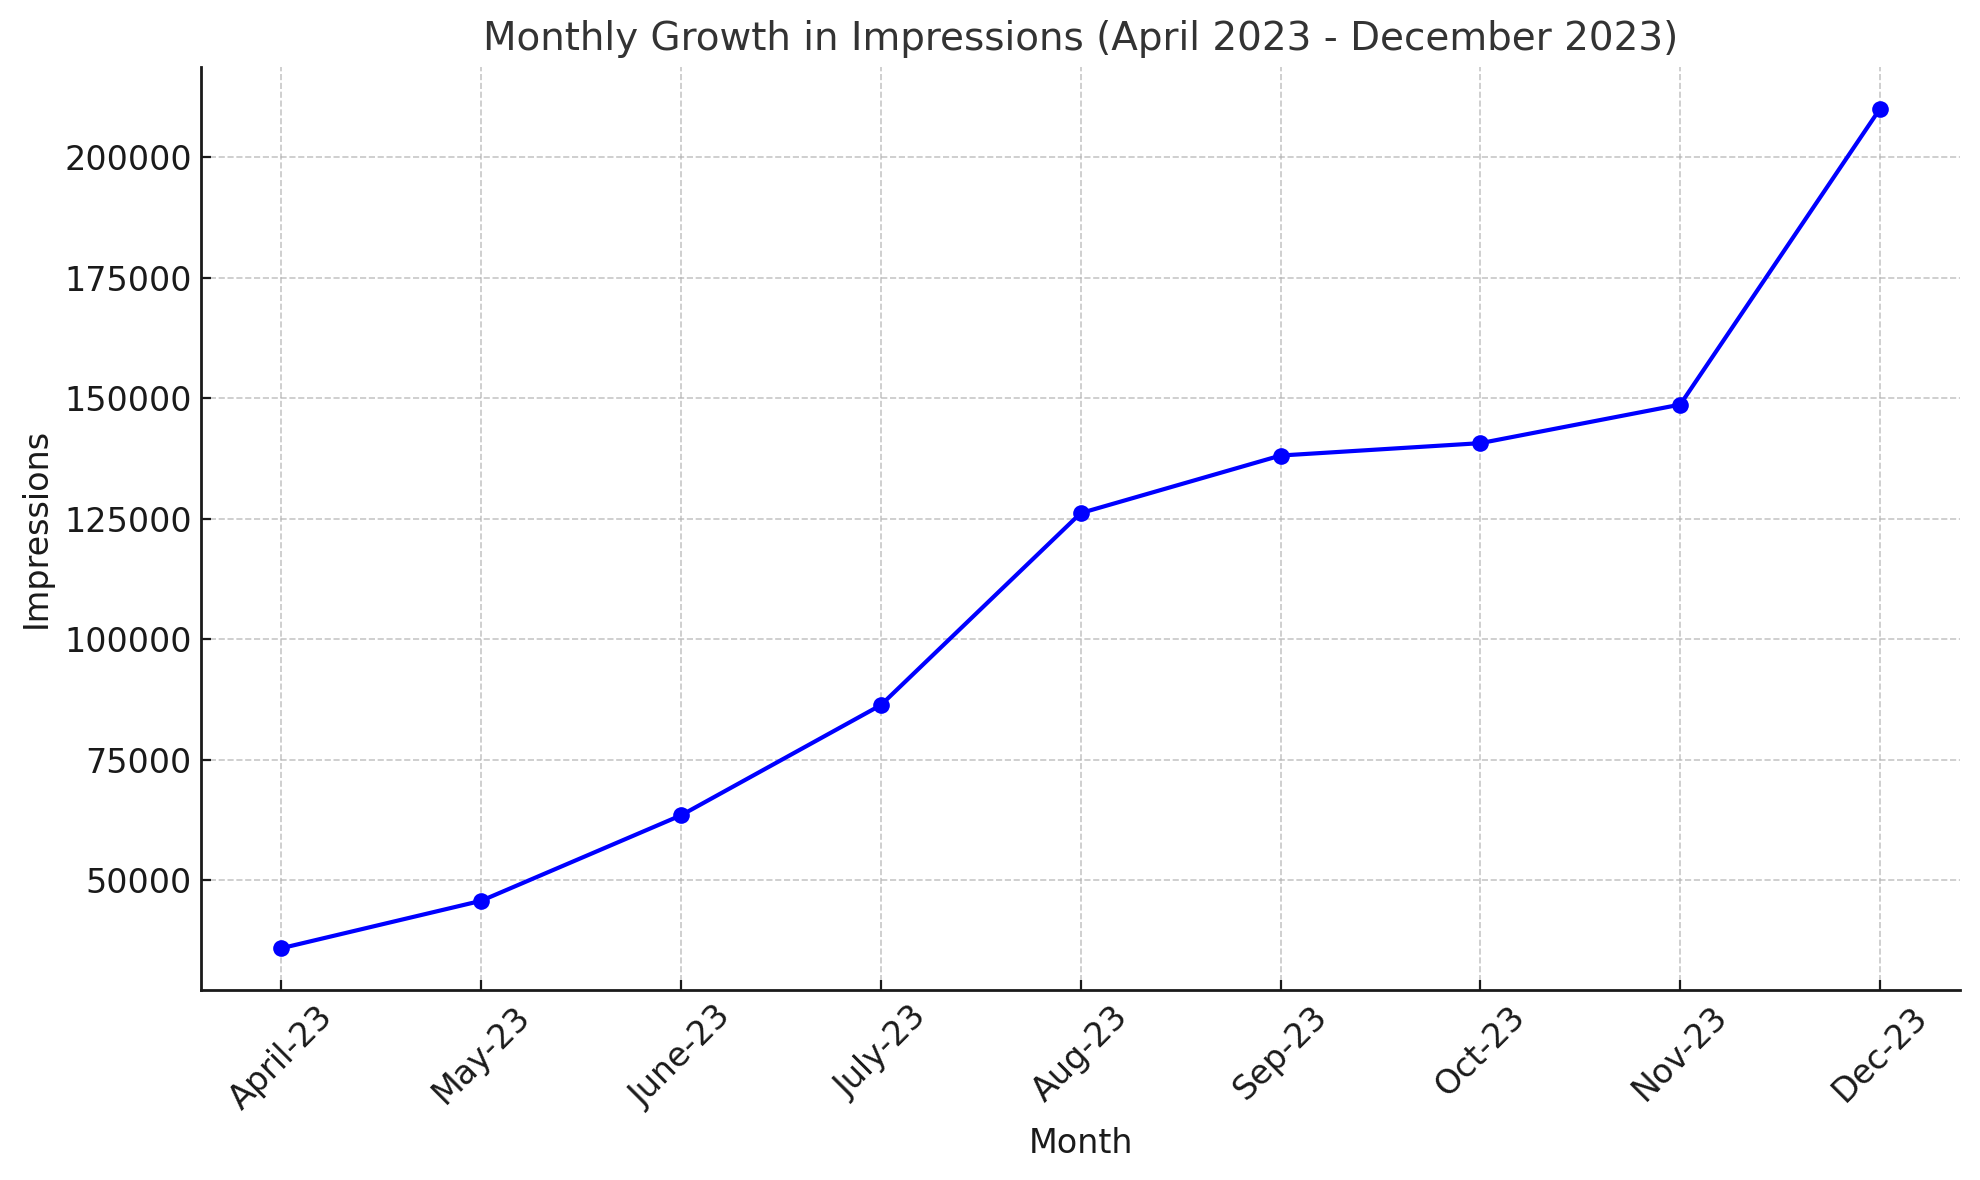
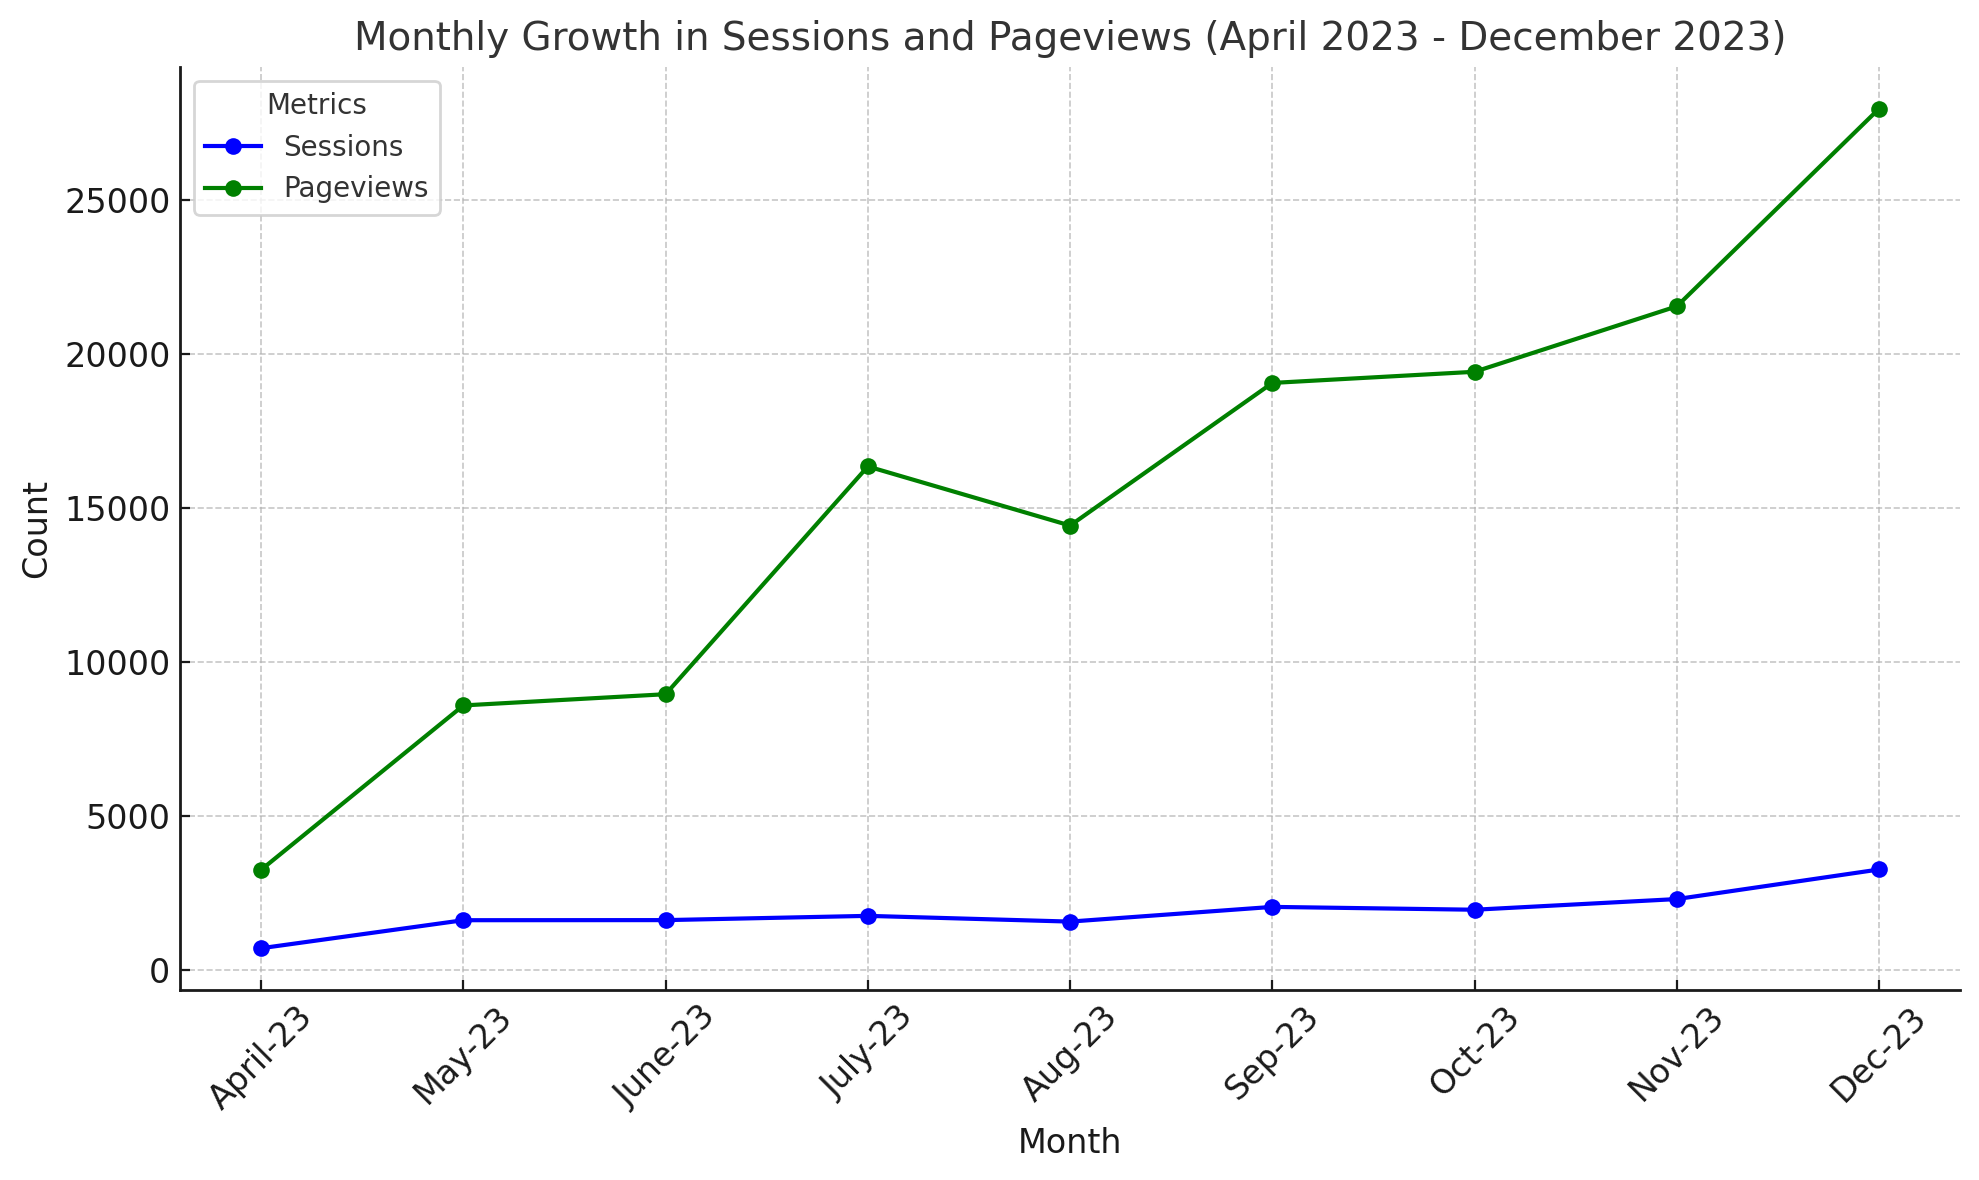
Monthly search impressions grew almost sixfold, while organic sessions more than quadrupled. Explore each metric to see the full monthly pattern, including the quieter periods.
Organic sessions
714 → 3,269
+358%from the first check
View every checkpoint
Organic sessions by reporting checkpoint
Month
Organic sessions
Apr 2023
714
May 2023
1,623
Jun 2023
1,626
Jul 2023
1,764
Aug 2023
1,578
Sep 2023
2,055
Oct 2023
1,963
Nov 2023
2,309
Dec 2023
3,269
Search impressions: +485%
35,930 → 210,014. The store appeared more often in Google search results between April and December 2023.
Organic sessions: +358%
714 → 3,269. The supplied report records substantially more organic visits by December.
Organic pageviews: +758%
3,258 → 27,956. Recorded pageviews increased alongside visits; pageviews alone do not establish engagement quality.
03 / A stronger ranking footprint
More first-page keywords. More top-three positions.
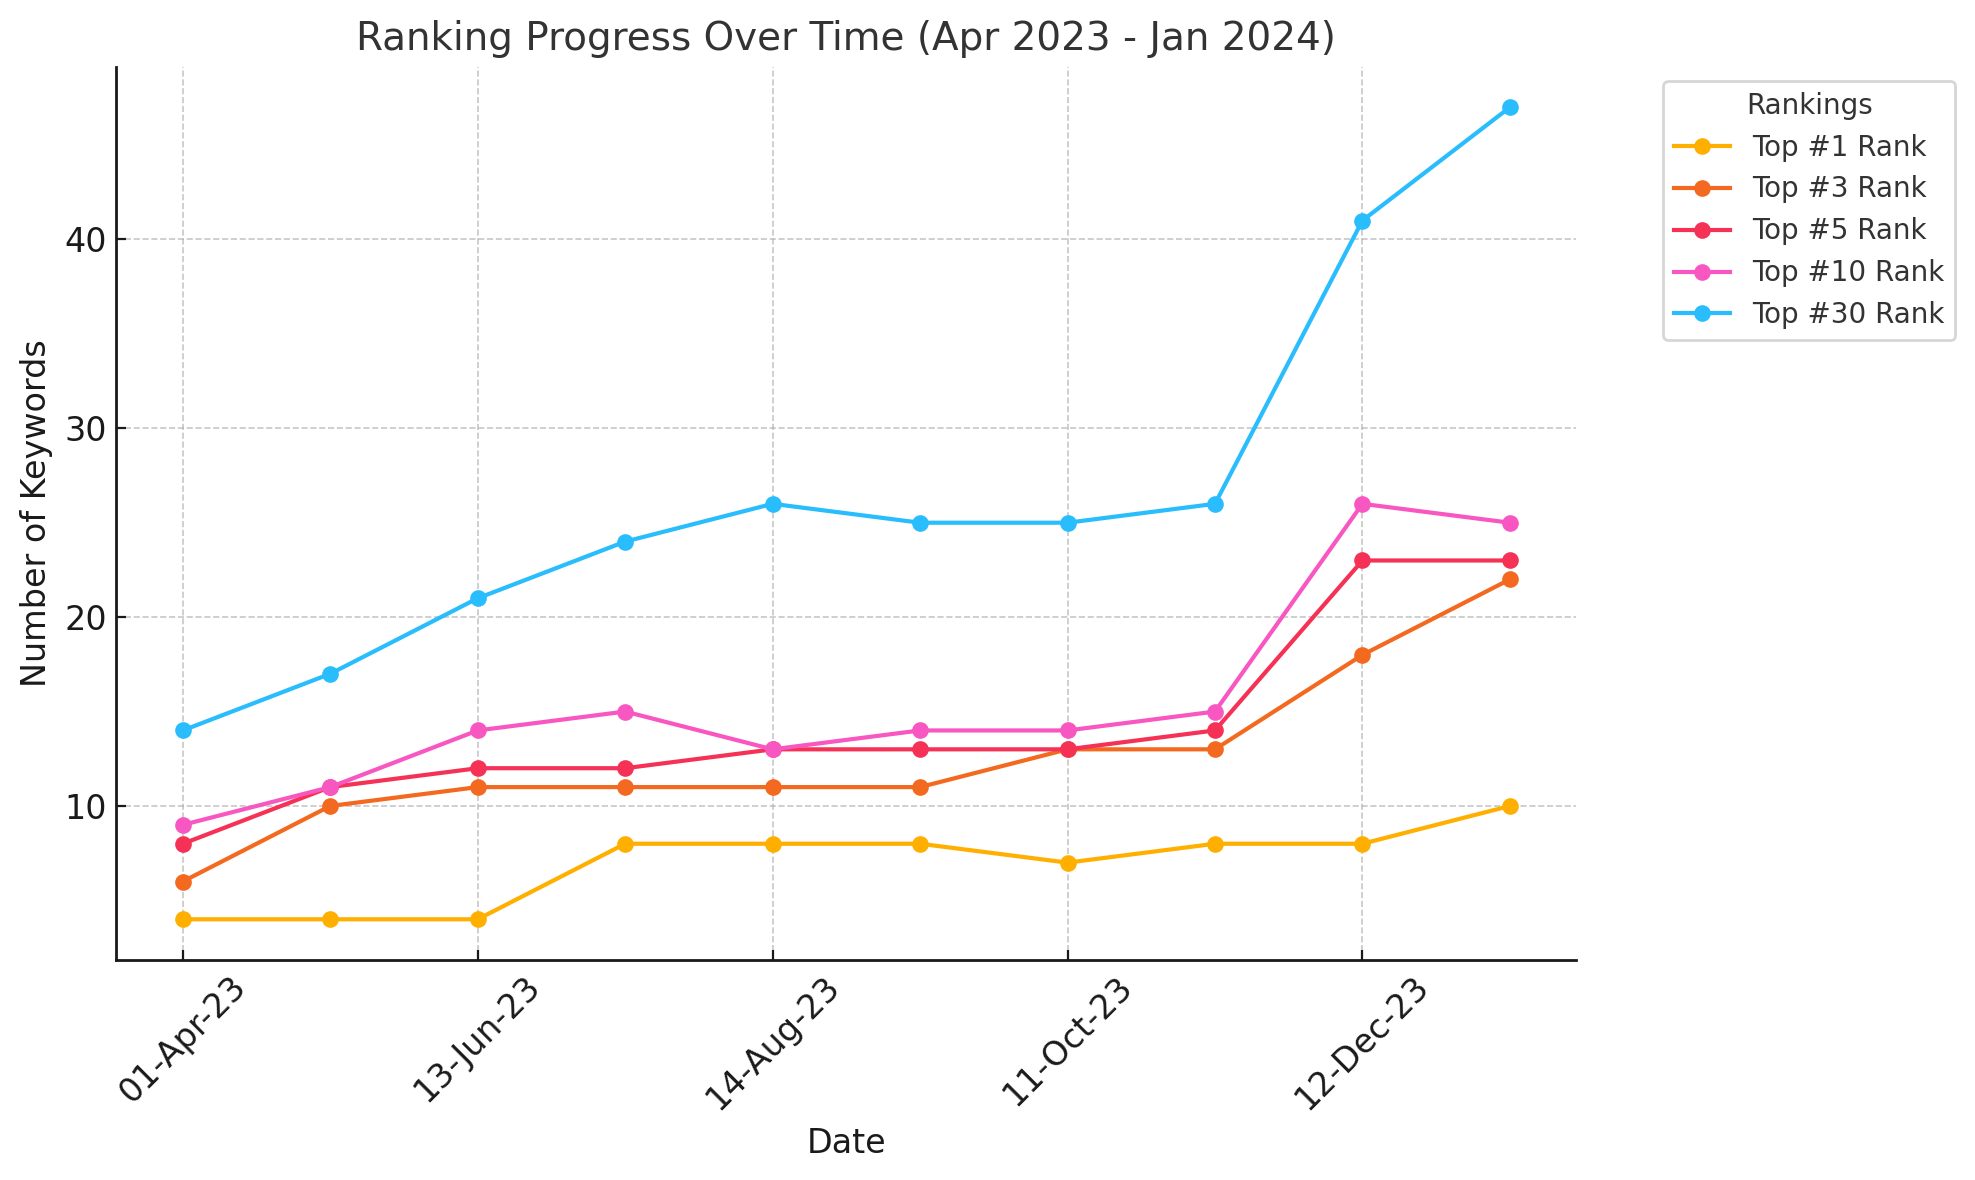
By January 15, 2024, ten tracked keywords held the number-one position and 22 were in the top three. First-page coverage grew from nine keywords to 25.
Top 10
9 → 25
+178%from the first check
View every checkpoint
Top 10 by reporting checkpoint
Date
Top 10
01-Apr-23
9
15-May-23
11
13-Jun-23
14
11-Jul-23
15
14-Aug-23
13
13-Sep-23
14
11-Oct-23
14
13-Nov-23
15
12-Dec-23
26
15-Jan-24
25
Ranking groups are cumulative: top-three keywords are included in the top-ten total. The series begins April 1, 2023. Top-ten rankings peaked at 26 in December and finished at 25 in January; all supplied checkpoints are retained.
Product searches with measurable progress
Selected examples from the supplied keyword table.
Selected rankings: April 10, 2023 and January 15, 2024
Keyword
Apr 10, 2023
Jan 15, 2024
Funko PoP Starter Box
#7
#1
Funko PoP! Movies Starter Box
#5
#1
Funko PoP! Marvel Starter Box
#2
#1
flame swordsman figpin
100*
#1
tenshinhan collectibles figpin
100*
#2
FiGPiN collectibles
100*
#3
buy figpin collectibles
100*
#3
attack on titan figpin
100*
#5
McFARLANE collection
100*
#10
*The source records “100” for these baseline values without defining whether that means an exact position or a tracking limit. We preserve that value and do not calculate an exact position gain. Case-only duplicate examples are omitted from this selected table.
04 / Activity closer to a sale
Beyond being found. More recorded shopping actions.
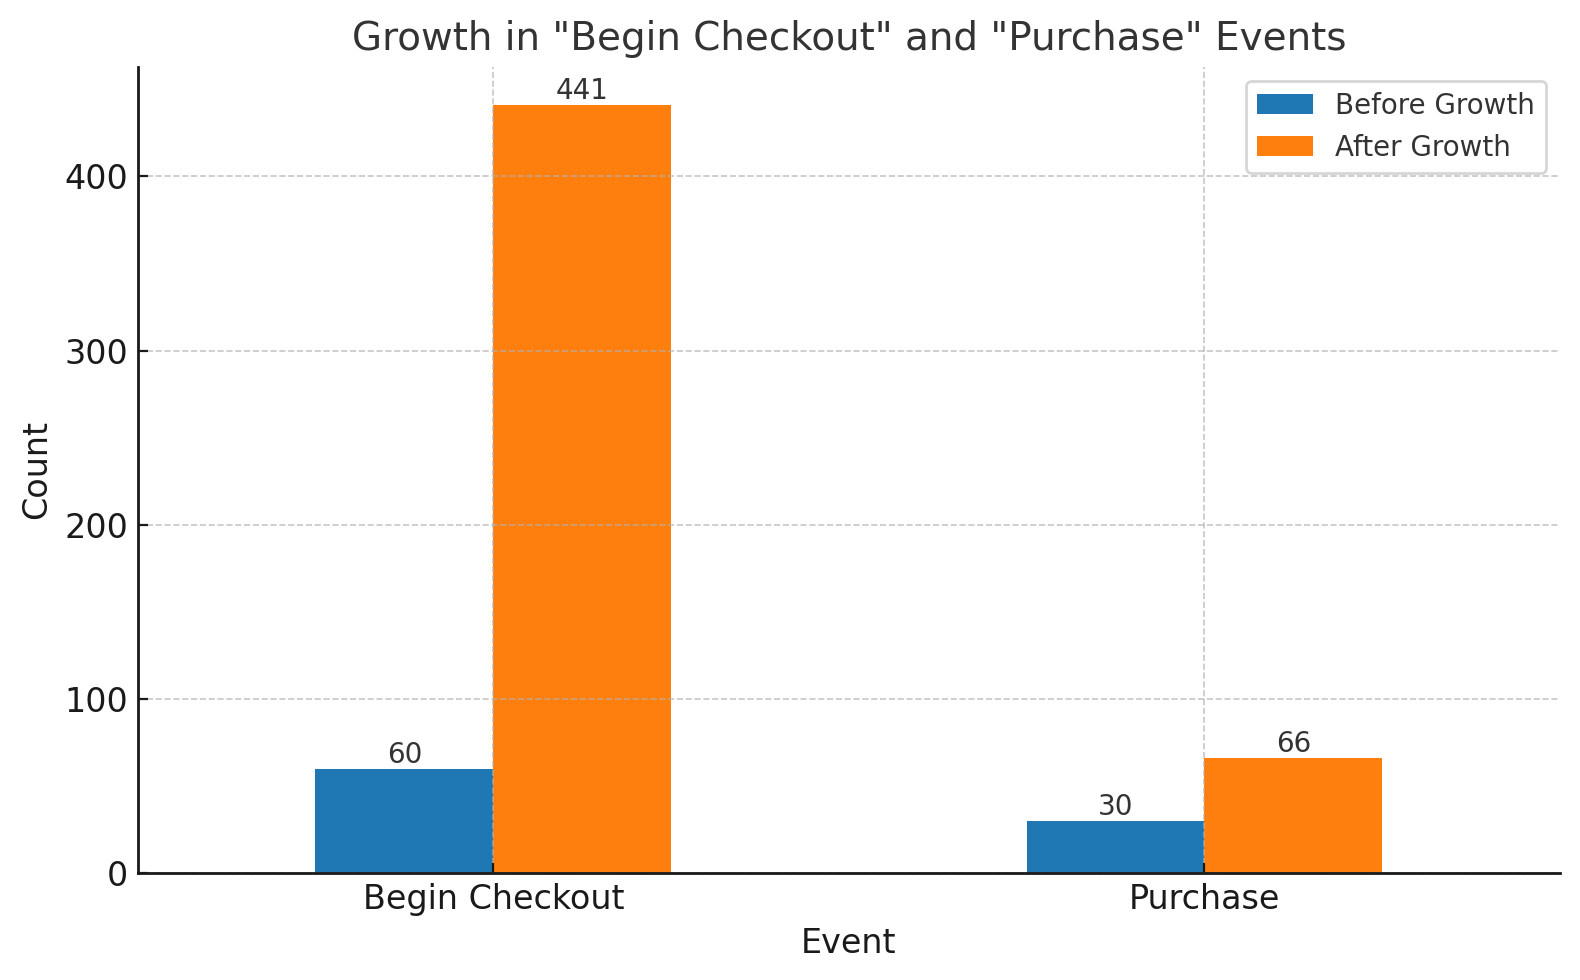
The report also supplies before-and-after events within organic traffic. Checkout starts and purchase events both increased, adding a commercial dimension to the visibility story.
Begin checkout
+635%
60 → 441
Before
60
After
441
Purchase events
+120%
30 → 66
Before
30
After
66
The event comparison does not state dates, equal reporting durations, revenue, or transaction deduplication. These figures show recorded event growth; they do not establish a conversion-rate increase or revenue growth and are not combined with the monthly session series.
What small retailers can take from this
Your niche can be a useful starting point.
Poptopia’s results show why an ecommerce SEO case study should look beyond one broad keyword. A mix of collection, product, character, and buying-intent searches can reveal how a specialist store’s visibility is developing.
The data also shows why rankings, visits, and shopping actions deserve separate attention. Here, each improved across its reported comparison. Understanding what happens after a visit still requires the store’s measurement setup, order records, and business context.
This historical Poptopia campaign was supplied by Peeyush Dubey for the NJ SEO LLC portfolio. Figures are transcribed from “SEO_Case_Study-Poptopia-Data.docx” and its four supporting charts. The archive contains copies of these same materials.
Traffic and impression comparisons run from April to December 2023. Aggregate rankings run from April 1, 2023 to January 15, 2024; the individual keyword table starts April 10, 2023. Event-comparison dates are not specified. Percentage growth is calculated as (final − baseline) ÷ baseline and rounded to the nearest whole percent. The impression table’s 41% figure is the November-to-December increase; April-to-December growth is approximately 485%.
Campaign activities were confirmed by Peeyush Dubey: business and competitor research, keyword research, critical technical fixes, sitewide on-page optimization, and link building. The supplied results do not isolate the contribution of each activity. Seasonal demand, inventory, and other marketing activity are not isolated in the supplied data. Visit Poptopia’s store.
For small stores with room to grow
Find your next search opportunity.
Share your store, priority products, and growth goals. We’ll review where your catalog could be easier to discover and where the shopping journey needs attention.